Sri Lanka’s Road Safety | Understanding how, when, and why crashes happen is key to reducing fatalities and serious injuries. This article uses a demonstration dataset for Jan 2024 – Sep 2025 to show how regular crash reporting can drive faster, smarter interventions.
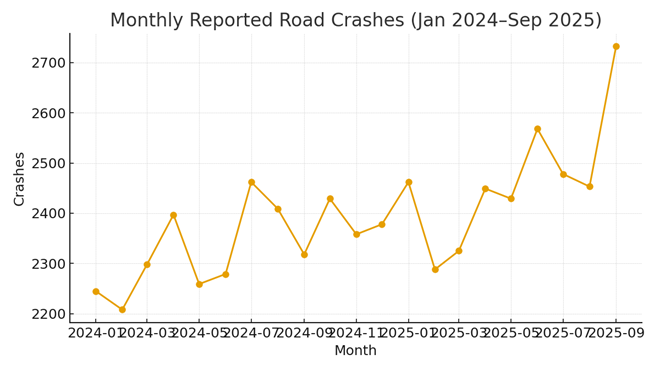
Monthly Crash Trends
Crashes hover around 2,200–2,600 per month. This pattern reflects seasonal fluctuations and enforcement gaps.
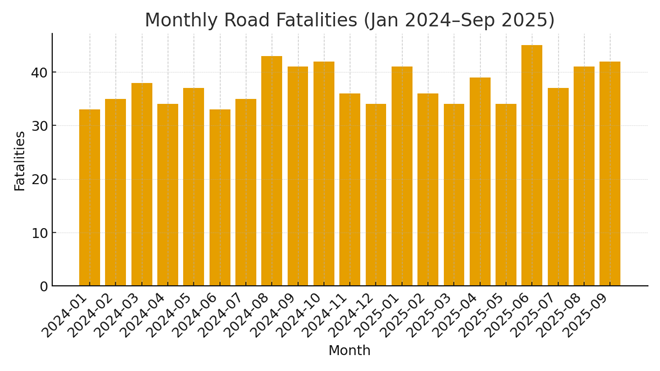
Monthly Fatalities
Fatalities track roughly 1.4 – 1.8 % of total crashes. Clear monthly tracking allows authorities to see if interventions are bending the curve.
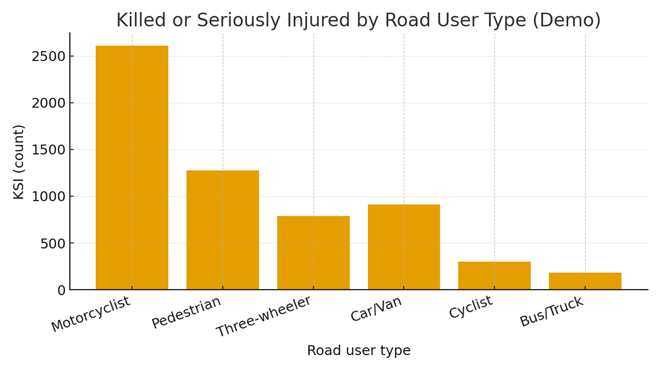
Who Is Getting Hurt
Motorcyclists make up the largest share of killed or seriously injured, followed by pedestrians. These groups should be the focus of low-cost, high-yield safety measures.
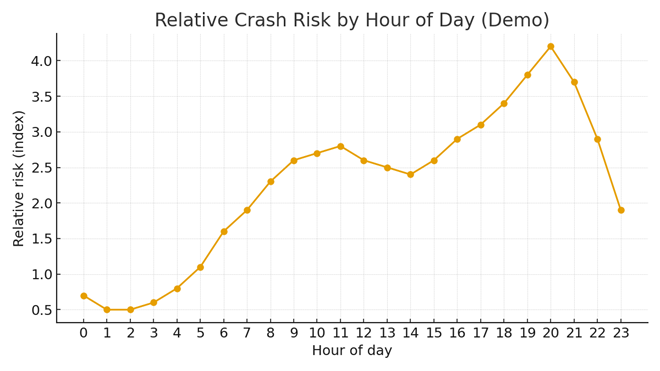
When Risk Spikes
Crash risk peaks in the evening hours. Enforcement, awareness, and roadside safety measures should align with these high-risk windows.
What To Do Next
1. Target blackspots with lighting, signage, speed calming, and visible pedestrian crossings
Road crash data consistently shows that a small number of locations account for a disproportionate share of fatalities. These “blackspots” often suffer from poor visibility, confusing signage, or unsafe pedestrian access. Installing street lighting, clear speed-limit signs, rumble strips, and zebra crossings at these sites can dramatically reduce risk. These are low-cost, high-impact interventions especially when paired with community mapping and real-time traffic data to identify priority zones.
2. Increase helmet and seatbelt compliance to at least 90% in high-risk areas
Helmet and seatbelt use is one of the most effective ways to reduce injury severity in crashes. Yet compliance often drops in peri-urban and rural zones, especially during off-peak hours. Targeted enforcement combined with public awareness campaigns and visible checkpoints can push compliance rates above 90%. This is especially critical in high-risk corridors where motorcycle and three-wheeler traffic dominates. Incentivising safety gear through insurance discounts or school-based education can also help shift norms.
3. Focus night-time enforcement where hourly risk is highest
Crash risk spikes after dark, particularly between 7 PM and 2 AM when visibility drops and driver fatigue or alcohol use rises. Instead of blanket enforcement, authorities should concentrate patrols and checkpoints during these high-risk hours. Mobile breathalyzer units, speed cameras, and reflective gear checks can be deployed strategically. Night-time enforcement sends a clear deterrent signal and protects vulnerable road users like pedestrians and cyclists who are harder to spot in low light.
4. Publish a monthly “State of the Roads” scorecard
Transparency drives accountability. A monthly scorecard showing crash hotspots, enforcement actions, compliance rates, and infrastructure fixes helps citizens, planners, and policymakers track progress. It also builds public trust and encourages data-driven decisions. The scorecard should be visual, accessible, and updated regularly ideally with district-level breakdowns and community feedback loops. Over time, it becomes a tool not just for reporting, but for reform.
Conclusion on Road Safety
Improving road safety in Sri Lanka demands more than enforcement it requires data-driven action, targeted infrastructure fixes, and public accountability. By focusing on blackspots, compliance, night-time risk, and transparent scorecards, policymakers can save lives and rebuild trust. The road to safety starts with visibility, consistency, and community-informed design.